

|
|
|
|
|
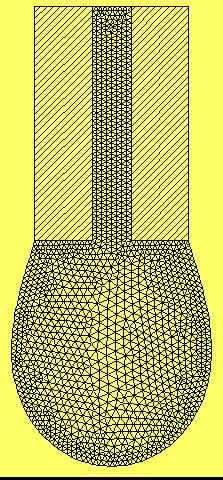
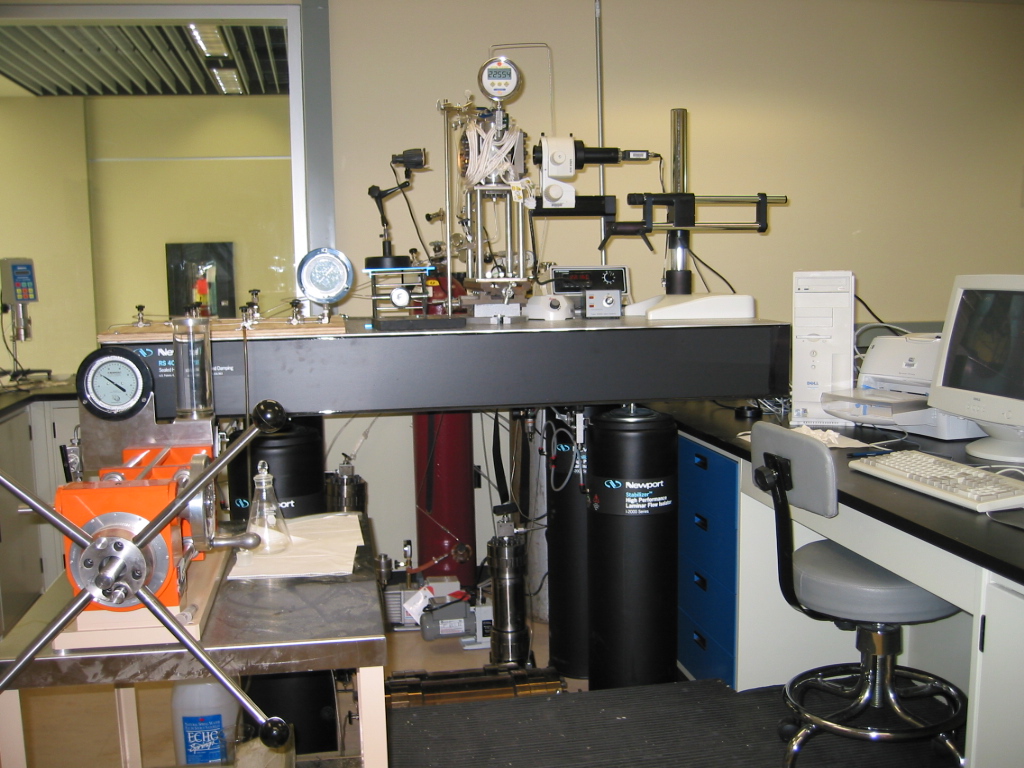
Research Facilities 1. Axisymmetric Drop Shape Analysis (ADSA) System The ADSA system, as shown in Figure 1,
is probably the most advanced and accurate method for measuring the
dynamic and equilibrium interfacial tension (IFT) and contact angle in
large ranges of pressures and temperatures. In principle, the ADSA
technique determines the IFT from the drop shape analysis. In
experiment, a pendant liquid drop is formed at the tip of a syringe
needle. Then its digital image is acquired by using a digital image
acquisition system. By applying computer digital image analysis and
processing techniques, the accurate interfacial profile of the pendant
drop is obtained. Finally, the IFT of the pendant liquid drop is
determined by solving the Laplace equation of capillarity and finding
the best fit of the numerically calculated interfacial profile to the
physically observed drop profile. In comparison with the other existing
methods, the ADSA technique is accurate for the IFT measurement (±0.05
dyne/cm) for the pendant drop case and for the contact angle measurement
(±0.1°) for the sessile drop case, fully automatic, and completely free
of the operator's subjectivity. At present, this technique is a
standard method for measuring the IFT and the contact angle.
|
|
|
Figure 1. Schematic diagram of the axisymmetric drop shape analysis (ADSA) system.
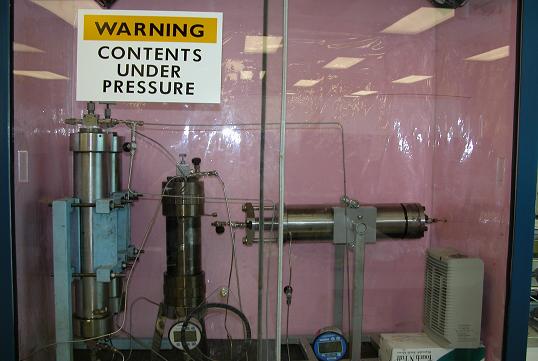
2. Interfacial Interactions Facility The interfacial interactions setup is used to study the interfacial interactions, including interfacial tension, wettability, diffusion and dispersion, among crude oil, brine, reservoir rocks and injected solvents, such as CO2 under reservoir conditions. As shown in Figure 2, the major component of this setup is a see-through windowed high-pressure cell (IFT-10, Temco , USA ). The maximum operating pressure and temperature of this pressure cell are 69 MPa and 177°C, respectively. The temperature during the test is maintained by wrapping the pressure cell with two heating tapes (HT95504x1, Electrothermal , USA ), which are connected to a stepless temperature controller (CN45515, Thermolyne , USA ). There are a total of six ports around the pressure cell. The top port is usually used to introduce a pendant oil/brine drop in the presence of CO2 phase and the bottom port is served as a draining outlet. Among the other four ports on the side, one is for pressure measurement using a digital pressure gauge (DTG-6000, 3D Instruments, USA), one is for temperature measurement using a thermocouple (JMQSS-125U-6, Omega, USA) and a temperature display (MDSS 41-T-A, Omega, USA), one is for installation of a rupture valve (P-7019, Oseco, USA), and the last one is for injection of CO2. The entire experimental setup is mounted on a vibration-free table (RS 4000, Newport , USA ). A DELL desktop computer is used to acquire the digital image of the pendant fluid drop and perform the subsequent image analysis, digitization and computation. Figure 2. The experimental setup used to study the interfacial interactions of the crude oil-brine-CO2-reservoir rock systems under reservoir conditions.
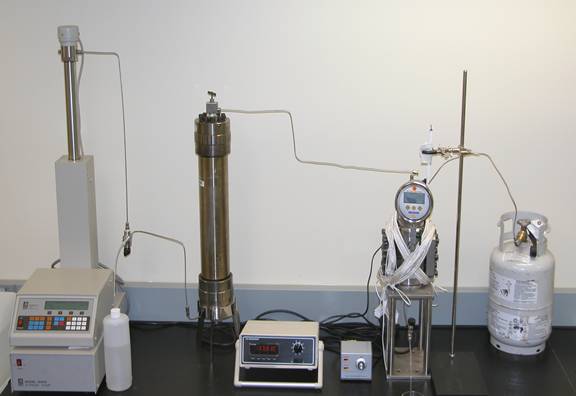
3. Pressure Decay Measurement Setup The pressure decay measurement setup, as shown in Figure 3, is used to measure the decaying pressures as the solvent gradually diffuses into heavy oil inside a closed high-pressure diffusion cell at a constant temperature. The experimental apparatus comprises of a stainless steel cylindrical diffusion cell (CYL-0250-10NP-316-2, DBR, Canada). The maximum operating pressure and temperature of the diffusion cell are 69 MPa and 200 °C, respectively. The diffusion cell is mounted vertically on a metal support throughout the experiment. The heavy oil sample is introduced into the diffusion cell by using a piston pump (PMP-500-1-10-HB-316-MO-CO, DBR, Canada). In addition to the above-mentioned diffusion cell, another main component in the experimental apparatus is a high-precision Digiquartz pressure transducer (46KR-101, Paroscientific, Inc., USA), which is connected to the top port of the diffusion cell. This transducer is used to measure the absolute pressure in the solvent phase inside the closed diffusion cell with an accuracy of 0.01% at a full scale of 41,385 kPa. The whole experimental setup is placed inside an air bath, where a temperature controller (Standard-89000-00, Cole-Parmer Instrument Company, Canada) is used to control the heat supply from an electric heater. Figure 3. Pressure decay mesurement setup used to measure the solvent-heavy oil diffusion coefficient.
4. Vapor-Liquid Equilibrium (VLE) Setup Figure 4 shows a digital photo of the VLE setup for measuring the solubility of a solvent in heavy oil. The apparatus mainly consists of a see-through windowed high-pressure cell (P/N 2329-800, Ruska Fluid Products, Chandler Engineering, USA), a programmable syringe pump (100DX, ISCO Inc., USA), and a computer-aided digital image processing and analysis system (LIA Technologies Inc., Canada). The see-through windowed pressure cell allows direct visual observation of the interactions between solvent and heavy oil. It has an internal volume of 100 cm^3 and can sustain pressures up to 69 MPa. The operating temperature of the pressure cell is from –17 to 148°C. The programmable syringe pump can operate continuously and automatically deliver the exact amount of heavy oil under a high pressure. A light source and a diffuser provide uniform illumination for the pressure cell. A MZ6 microscope ( Leica , Germany ) and a CCD camera with 640 x 480 pixels are used to observe the interface formed between the solvent phase and the heavy oil phase. The temperature during the test is maintained by wrapping the pressure cell with two heating tapes (HT95504x1, Electrothermal, USA ), which are connected to a stepless temperature controller (CN45515, Thermolyne , USA ). The pressure measurement is carried out by using a digital pressure gauge (DTG-6000, 3D Instruments, USA ). Figure 4. Vapor-liquid equilibrium (VLE) setup used to measure the solubility of a solvent in a heavy oil sample.
5. High-Pressure Coreflood Test Facility Experimental study of a waterflood or a chemical flood in a homogeneous system is usually performed in short one-dimensional sand-packs or Bera cores. Coreflood tests are conducted to study the oil recovery and to determine the chemical concentration profiles of the produced fluids in alkaline floods, surfactant floods, AS floods, polymer floods, and ASP floods. The schematic diagram of the setup used in coreflood tests is shown in Figure 5. As indicated in this figure, the coreflood setup consists of the following major parts: vacuum pump, positive displacement pump, hydraulic cylinders, pressure gauges, back-pressure regulator (BPR), sand-pack/Berea cores, and high-pressure coreholder. The vacuum pump is Maxima plus M2C (Fisher Scientific, Canada), which is used to evacuate the sand-pack or the Berea core. The DBR-JEFRI pump (Model PMP-1000-1-10-M-316-M4-40, DB Robinson Group, Canada) is used to pump fluids (the crude oil, brine or chemical solutions) through the sand-pack or the Berea core. Three 500 ml hydraulic cylinders (DB Robinson Group, Canada) are used to deliver the crude oil, the brine, and the chemical solutions, respectively. The sand-packs are 6'' long and 1.5'' in diameter and their absolute permeabilities are in a range of 5-7 Darcy. The Berea core is homogeneous split rock from Cleveland Quarries, USA. The Berea cores are 5'' long and 2'' in diameter and their absolute permeabilities are in a range of 0.05-0.08 Darcy.
Figure 5. Schematic diagram of the high-pressure coreflood test facility. 6. Oil-in-Water Emulsion Coalescence Test Setup The coalescence test setup is used to study the coalescence performance of oil-in-water emulsion flowing through a coalescing bed. The entire experimental setup consists of the following parts: homomixer, two feed tanks, a magnetic stirrer, two gear pumps, a coalescing bed and a differential pressure transducer as shown in Figure 6. A homomixer (Model: 1L, Greerco, Chemineer, Inc., USA) is utilized to make a stable emulsion. The maximum operating speed of this homomixer can reach 7,600 rpm. In addition, this homomixer can be set at any speed in the range of 0-7,600 rpm with a stepless transformer (Model: 3PN1010B, Energy Products Co., USA). Two feed tanks are used to store the bulk water and the concentrated emulsion. The bulk water feed tank is a plastic container, which has a capacity of approximately 22.3 liters. The concentrated O/W emulsion is stored in a glass beaker and stirred on-line with a magnetic stirrer (Model: SP 46925, Cimarec Co., USA). Two gear pumps (Cole-Parmer Instrument Co., Canada) are used in this study. One pump (EW-75211-10) is used to deliver the bulk water so that it will be mixed with the concentrated emulsion before the mixture enters the coalescing bed, which has a flow rate range of 13.1-939.6 ml/min. The other gear pump (EW-07002-32) is applied to transport the concentrated emulsion from the emulsion tank into the main flow pipe and its flow rate can be adjusted from 2.6 to 85 ml/min. A stainless steel cylindrical coalescing bed used in this study is 70 cm long with the inner diameter (ID) of 73 mm. The bed is flanged with a 15.2 x15.2 cm^2 square plate on each end. The inlet and outlet connections are made through these two end plates. The outer diameter (OD) of all the tubing used is 1/4''. Four ports are made available along the coalescing bed at 0, 20, 40, and 70 cm from the entrance for monitoring the pressure drop across the bed and/or taking the emulsion samples. Emulsion samples are collected through four ports, where a ball valve is installed. A differential pressure transducer (Model: P55D 1-N-1-58-W-4-A, Validyne Company, USA) is used to measure the pressure drop along the coalescing bed. The accuracy of the pressure transducer is 0.25% of its full scale, which is adequate for this experimental study. Figure 6. Coalescence test setup used to study the coalescence performance of oil-in-water emulsion flow through a coalescing bed.
7. VAPEX Physical Model Figure 7 shows the vapour extraction (Vapex) experimental set-up established at the Petroleum Technology Research Centre (PTRC), which consists of a Vapex physical model, a solvent tank, a back-pressure regulator, a bubbler, a beaker and two light sources. The major component of the set-up is the Vapex physical model, which is shown in Figure 8. This model is made of three rectangular plates. A back plate made of thick stainless steel (483 mm x 178 mm x 50.8 mm) is grooved to form a 3-D rectangular cavity (400 mm x 100 mm x 20 mm), which is used for sand packing. There are a total of sixteen ports around the back plate, which provide flexible locations of the injector and producer. The front plate of the model is made of a 50.8 mm thick acrylic used as a visual window through which the solvent extraction process of heavy oil can be visualized. A thin polycarbonate plate is placed between the back and front plates, which is used to prevent the front plate from scratching. This thin plate is subdivided into 40 grids with the dimensions of 10 mm x 10 mm for each grid so that the interface between the vapour chamber and the untouched oil zone can be quantitatively located. A 6.35 mm thick metal frame is placed to support the front plate and the Vapex physical model has a maximum working pressure of 3.0 MPa at 23.9°C. The Vapex physical model is mounted on a specially designed stand and can be rotated freely and set at any inclination angle. Figure 7. The Vapex set-up at the PTRC Figure 8. TheVapex physical model In the experiment, propane and butane are used as solvents to extract the heavy oil. As shown in Figure 9, the producer is chosen at the center bottom of the Vapex physical model, while the injector is located at 3.5 cm above the producer. In one test, a mixture butane (70 mole% n-butane + 30 mole% iso-butane) is chosen as a gaseous solvent to extract heavy oil at a pressure slightly lower than its dew-point pressure and a constant temperature. The Vapex process is visualized to determine the so-called vapour chamber rising (see Figure10a), side-spreading (see Figure10b) and falling (see Figure10c) phases. The accumulative oil production versus time curve for Run 3 conducted on August 12, 2005 is shown in Figure 11.
Figure 9. The locations of the injector and producer Figure 10a. Vapour chamber rising phase in Run 3
Figure 10b. Vapour chamber side-spreading phase in Run 3 Figure 10c. Vapour chamber falling phase in Run 3
8. See-Through Windowed High-Pressure Crude Oil-Solvent Saturation Cell Figure 12 shows a specially designed see-through windowed high-pressure saturation cell which can be used to study the dissolution of solvent into a crude oil at different high equilibrium pressures and elevated temperatures. A stainless steel plate is machined and placed between two transparent acrylic plates to form a rectangular cavity (30.48×5.08×1.91 cm3). The maximum working pressure of the saturation cell is equal to P =6.9 MPa at room temperature, which is higher than most Canadian heavy oil reservoir pressures. There are a total of six sampling ports at different vertical locations along the saturation cell and two sampling ports at two ends of the saturation cell, from which the solvent-saturated crude oil at different layers of the bulk oil phase can be easily sampled. The saturation cell is mounted on a metal support and can be rotated freely to accelerate the dissolution of solvent into crude oil. Figure 12. The see-through windowed high-pressure saturation cell used for saturating crude oil with solvent at different high pressures and elevated temperatures. In one saturation test, 5 cm3 of heavy oil sample is injected into the saturation cell and saturated with propane (C3H8). Sequential digital images of the heavy oil–solvent system are taken through the acrylic window of the saturation cell at different saturation pressures by using a MZ6 microscope camera (Leica, Germany). Figure 13 shows a small surface area (0.5×0.4 cm2) of the acrylic window. At t =0 s and P =850 kPa, the acrylic window is covered with deposited small asphaltene particles. When the saturation pressure is suddenly reduced to P =780 kPa, the deposited asphaltene particles start to become liquid-like and mobile at t>30 s. After t =1,200 s, all the deposited asphaltene particles completely become liquid-like.
Figure 13. Six sequential digital images of asphaltene deposits on the acrylic window of the saturation cell at P =850 kPa and T =20.8°C and their state change from solid-like to liquid-like at P =780 kPa and T =20.8°C. In another saturation test, 150 cm3 of heavy oil is saturated with propane at P =850 kPa and T =20.8°C. The heavy oil–propane system reaches the saturation state after the saturation cell is frequently rotated for 24 h. Figure 14 shows a significant amount of asphaltene deposits found at the bottom of the saturation cell at the atmospheric pressure and T =20.8°C after the saturation test. These asphaltene deposits are solid-like initially and then become liquid-like after they are placed under the ambient conditions for one month. Figure 14. Asphaltene deposits found at the bottom acrylic window of the saturation cell at the end of the heavy oil–propane saturation test at P =850 kPa and T =20.8°C.
|
|||||||||||||||
Copyright 2014, Dr. Peter Gu's Research Group, University of Regina. All rights reserved. This WWW page is an official communication of Dr. Peter Gu's Research Group, Petroleum Systems Engineering, Faculty of Engineering and Applied Science, University of Regina, 3737 Wascana Parkway, Regina, Saskatchewan S4S 0A2, Canada |