Social Studies 201
Winter 2001
Problem Set 4
Due March 16, 2001
1. Obtain the probability for question 5, (b), (i) of Computer Problem Set 3 using the normal approximation to the binomial. Compare with the correct probability (from the MINITAB printout) and comment on any reasons for differences between the two results.
Computer problem 5, (b)
An October, 2000 poll by Globe and Mail/CTV/Ipsos-Reid showed that 52% of Canadian voters polled said they supported the federal Liberals at that time (The Globe and Mail, October 17, 2000, p. A1). Assume that this represents all Canadian voters and suppose that a random sample of 28 voters is selected. (a) For the sample of 28, obtain the probability distribution for the number of supporters of the Liberal party. (b) What is the probability of (i) selecting less than 10 Liberal supporters, (ii) selecting less than one-quarter Liberal supporters, and (iii) selecting at least one-half Liberal supporters?
2. According to data from Statistics Canada, General Social Survey, Cycle 11, 1996, approximately 25\% of Saskatchewan adults smoke cigarettes. If a random sample of 8 Saskatchewan adults is selected, use the normal approximation to the binomial to
estimate the probability that (a) less than 3 of those selected are smokers, and (b) 6 or more of those selected are smokers. If you walk by an office building in downtown Regina and observe a group of 8 workers outside the building, each of them smoking, how do you explain this in view of the probability in (b)?
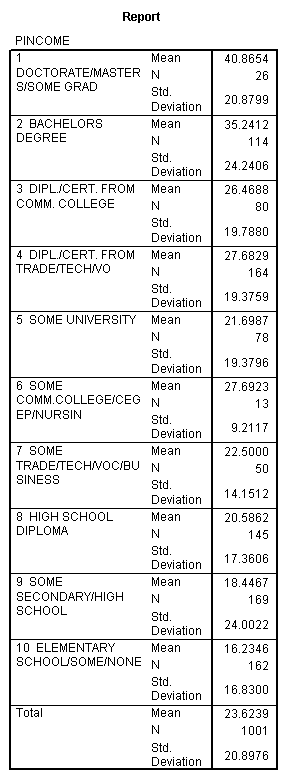
3. Table 1 is obtained from Statistics Canada, General Social Survey, Cycle 11, 1996. The data provide statistics on personal income for a random sample of Saskatchewan adults, classified by their level of education. For each category of education, the table gives the value of mean annual income (in thousands of dollars), the sample size (N), and the standard deviation of annual income (in thousands of dollars).
(a) Obtain a 95% confidence interval estimate for the mean annual income for all Saskatchewan adults with (i) a bachelors degree (category 2) and (ii) a diploma or certificate from a community college (category 3).
(b) Obtain a 90\% confidence interval estimate for the mean annual income for all Saskatchewan adults with (i) some university (category 5), and (ii) only high school or a diploma (category 8).
(c) Briefly comment on the meaning of the results in (a) and (b).
4.
Interval Estimates from MINITAB
This problem asks you to obtain some interval estimates using the 372.mtw file. Once in MINITAB, use File – Open Worksheet – Select File and then find your way to t:\students\public\201 and obtain the 372.mtw file. After doing this, type info and press the Enter key to see that you have in fact obtained the correct file.
(a) MINITAB. Use Stat – Basic Statistics – 1 Sample t to obtain the following nine interval estimates:
(i) The 95% interval estimates for V4 (recognition of gay and lesbian couples as married), V9 (more dollars for health care), and INCOME (income of student’s household).
(ii) The 80% interval estimates for V4, V9, and INCOME.
(iii) The 99% interval estimates for V4, V9, and INCOME.
(b) Comments. Using these interval estimates, provide a short explanation for each of the following:
(i) Take one of the interval estimates and use the formula from the text or the class to show that the formula produces the same interval estimate as shown on the MINITAB printout. Show your calculations.
(ii) For one of the levels of confidence, explain why the interval estimates for V4 are wider than the interval estimates for V9.
(iii) Take one of the three variables (V4, V9, or INCOME) and explain why the interval estimate for the 99% interval is wider than the interval estimate for the 95% interval for that variable, and why these in turn are wider than the 80% interval estimate for the same variable.
(iv) Someone claims that the true mean household income for all University of Regina undergraduates is $60,000. Do the interval estimates for INCOME provide any evidence for this?
Table 1. Means, Standard Deviations, and Sample Sizes (N) of Personal Income Annually (in thousands of dollars) of Saskatchewan Adults in the 1996 General Social Survey, Classified by Education Level
