Department of Sociology and Social Studies
Department of Sociology and Social Studies
Who are We?
Report on the Survey of Student Life
Thank you for participating in the Survey of Student
Life. In November, 1997, students in Social Studies 306 surveyed
717 undergraduate students in 19 classes and conducted telephone
interviews with another 29 students. The information you gave
us about yourself is part of this sample of 746 University of
Regina undergraduate students. We highlight some of the findings
from the Survey in this Report.
Use of Alcoholic Beverages
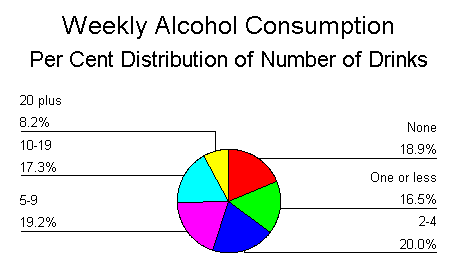
Of the students we surveyed, 19 per cent do not consume alcohol.
Another 40% consume alcohol rarely or only on special occasions.
In total, 43% of students consume 84% of all reported alcohol
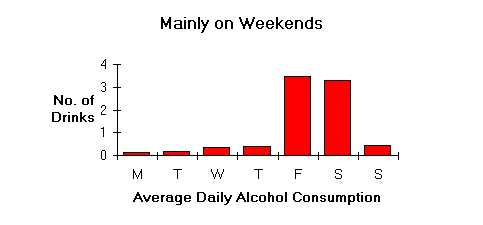
consumption. Females who use alcohol consume 6.1 drinks a week
on average, just over half of the 11.7 drinks consumed by males
weekly. Alcohol consumption differs little by year of University,
and there appears to be little relationship between student grades
and alcohol consumption. In this sample, the heaviest alcohol
consumption was reported in Fine Arts (11.2 drinks per week),
Engineering (10.1) and Administration (9.2). At the other end
of the spectrum, Education students reported only 6.9 drinks per
week, with Social Work (7.4), Science (7.5), Arts (7.8), and PAS
(8.1) in between.
| Why Drink Alcohol? | |
| Socializing | |
| Relieving stress | |
| Feeling better | |
| Meeting people | |
| Escaping personal problems | |
| Meeting sexual partners |
Handling Alcohol
Most
respondents seem to take care getting home after they have been
drinking, with 46% using a designated driver and many others using
a cab, bus, or walking. At the same time, 15% report driving
themselves home while intoxicated or driving with someone else
who has been drinking. These 15% also report drinking considerably
more heavily than those who use a safer method of getting home.
| Situation experienced | |||
| Regret drinking so much | |||
| Studies suffered | |||
| Relationships with friends or family suffered | |||
| Regret actions while intoxicated | |||
| Had blackouts | |||
| Became violent | |||
| Got into trouble with the law |
Drugs.
Several of you
asked us to include questions about drug use in the Survey.
We would have liked to include this subject, but decided against
it. The main reason was the ethical consideration that we should
not ask students to report on activities that are illegal (except
for driving home when intoxicated).
Health.
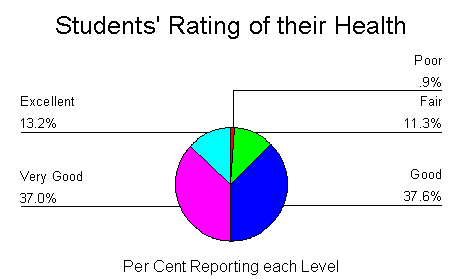
Two-thirds of students often or always eat regular, well
balanced meals, with the other third only sometimes doing so.
Smoking does not appear to be all that common among the students
we surveyed, with only 19 per cent reporting that they are smokers.
Among smokers, average cigarette consumption is reported as
9 cigarettes daily.
Students do not report heavy coffee consumption.
Two-thirds said they never consume coffee and one-quarter report
1 to 3 cups daily. Only 7 per cent say they consume four or more
cups a day. Five per cent reported being vegetarian, with females
reporting this more commonly than males. The faculties with the
greatest proportion of vegetarians were Arts, Fine Arts, Science,
and Social Work. Perhaps coffee consumption or being a vegetarian
are unrelated to health.
Visits to the dentist average about once a year.
On average, the number of doctor visits is three times a year,
with about 10 per cent reporting more than five visits per year.
Avoiding visits to the doctor because of the possible cost of
prescriptions is not common, but 14 per cent of students say that
they have done this. As a result, it is no surprise that over
50 per cent of students surveyed consider subsidized prescriptions
to be important. Even more would like subsidized dental care
- 57% consider this important - and 67% would like a full service
drop-in medical clinic on campus.
| Experience or Feeling | Experience or Feeling | ||||
| Learned something new | Isolated or lonely | ||||
| Sense of achievement | Thought of quitting university | ||||
| Interested by school work | Performance on exam suffered | ||||
| Very happy with exam results | Confused about direction | ||||
| Student life exciting | Lost sleep | ||||
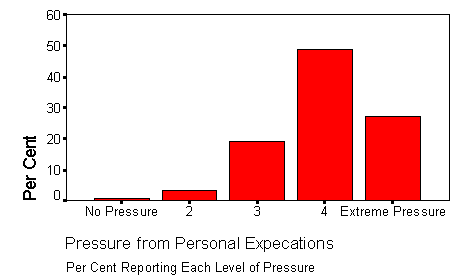
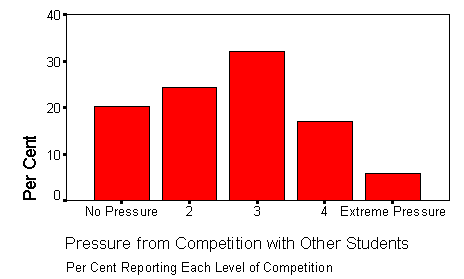
Pressure. Students say that the greatest pressure is from personal expectations (left bar chart), with pressure from workloads almost as much. At the other end of the spectrum, competition with other students (right bar chart) and parental expectations has minimal pressure. Between these is pressure from conflicts balancing school, job, and family.
Multiculturalism. Over two-thirds generally agree with multiculturalism in Canada, one-quarter are neutral, and and 5 per cent have a negative view of multiculturalism. The table below shows that there are varied views of the different aspects of multiculturalism.
| Aspect of Multiculturalism | |
| Equal access to jobs | |
| Preserve cultural heritage | |
| Cultural and racial diversity fundamental | |
| Eliminate barriers to participation | |
| Promote respect and recognition | |
| Government assistance to provide new skills | |
| Government funding for festivals |
Immigration. Most students expressed a view on immigration, with 30% saying that immigration to Canada should be more strictly controlled, 59% saying it should remain the same as it is now, and only 11% expressing the view that Canada should become more open to immigrants.
Identity. Three-quarters of students identified themselves as simply Canadian and another 8% as ethnic-Canadian. 9% identified themselves as their own ethnic origin. 9% of students said they had full or partial First Nations, aboriginal, or native ancestry. Among the aboriginal groups represented in the Survey are Cree, Dakota, Saulteaux, Métis, Assiniboine, and Iroquois.
Academic Experiences.
The overall grade point average is 74% with little difference
in grade point by year of university. Mean grade 12 grades average
80%, so a drop of about 6 percentage points from grade 12 to first
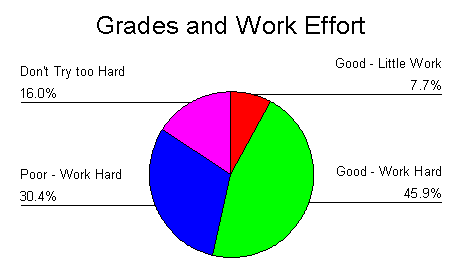
year university is to be expected. There are many approaches
to university and the pie chart shows that many students consider
themselves to be hard workers with this hard work paying off in
good grades. But a few get by with little work effort and sixteen
per cent don't knock themselves out trying to get a high grade.
Student Employment Patterns. In the Survey, 55% of students have jobs and those with jobs average 19 hours of work per week. One-fifth of these work at jobs 10 hours or less a week and 45% average 20 or more hours a week at jobs. Average hourly pay is $8.24 an hour, with 14% reporting pay of $5.60 or less an hour and 12% reporting pay of $20.00 or more an hour.
Who You Are. Females are 63.8% of the sample and males 36.2%. This means that we sampled classes with a disproportionate number of females. To be representative of the student body we should have had 60.1% female and 39.9% male in the sample. Just under one-half live with parents or other relatives, 13% with a spouse or partner, 16% with friends, 16% live on campus or alone, and 5% are single parents. Among all respondents, 11% have children and those with children average 2.0 children. One-fifth of students surveyed were over age 24 and the rest were between ages 17 and 23. In the Survey, 40 per cent of respondents are first year students, just under one-quarter are in each of the second or third year, and 13% are in fourth year or higher.
