Sampling from Small Populations

Evan Morris

What is a small population?

Many surveys deal with large populations, such as all adults in Canada, or all adults in Saskatchewan. The target populations of these surveys can contain hundreds of thousands or even millions of people. The sampling and statistical analysis methods presented in most textbooks assume that:
  • the population is very large, and
  • the size of the sample is small when compared to the size of the population.

    When the target population is less than approximately 5000, or if the sample size is a significant proportion of the population size, such as 20% or more, then the standard sampling and statistical analysis techniques need to be changed.

    When might we encounter small populations in research?

    Typical situations involving small populations include:
  • Sampling residents of a small town or small city.
  • Sampling employees in a firm.
  • Sampling members of a trade or professional group.
  • Sampling cows from a herd of cattle.
  • Sampling hospitals from around the country.
  • Sampling emissions from power plants in Canada.

    In each of these cases the target population may vary from several dozen to several thousand.

    How do we select a sample size when sampling a small population?

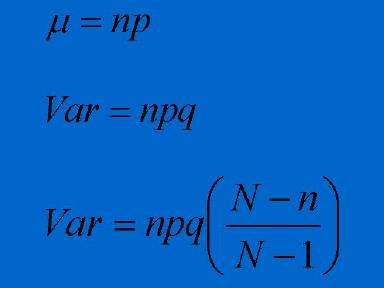
    When dealing with large populations, the sample size is determined using the normal approximation to the binomial distribution. This approximation is very accurate when the population is large, and the sample size is small. However, if you were to sample a population of 200 individuals, then for a given accuracy, you would require a far smaller sample than that calculated using the normal approximation to the binomial. To determine the sample size for small populations, we use the normal approximation to the hypergeometric distribution. The sample size formulas for large (binomial) and small (hypergeometric) populations are shown below.
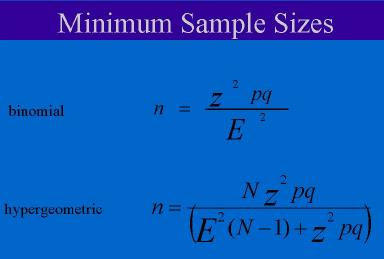
    Where
  • n is the required sample size
  • N is the population size
  • p and q are the population proportions. (If you don't know what these, are set them each to 0.5.
  • z is the value that specifies the level of confidence you want in your confidence interval when you analyze your data. Typical levels of confidence for surveys are 95%, in which case z is set to 1.96.
  • E sets the accuracy of your sample proportions. If you want to know what proportion of individuals are in favour of some policy, with an accuracy of plus or minus 3%, then E is set to 0.03.

  • For very small populations (50 or less), you need almost the entire population in order to achieve accuracy.
    There is a limit on the accuracy you can achieve when dealing with small populations. The maximum resolution you can achieve for a proportion is 1/N. If E is set smaller than this, you can never reach this accuracy even if you survey the entire population.

    How different are the sample sizes from small population vs large populations?

    If we are carrying out an opinion survey from a large population, and we want the confidence intervals for our sample proportions to have a 95% confidence level with an error of plus or minus 0.03%, then the minimum sample size required is 1,068 individuals.

    If we were to sample a small population, the sample size would be much smaller:
    Population SizeRequired Sample Size
    5000880
    1000517
    500341
    300235
    As the population size becomes smaller than 300, you might as well survey everyone in the population.

    Download an Excel worksheet that calculates the minimum sample size needed for a survey

    This file will be in a zipped format. Download now

    Confidence intervals for samples from small populations

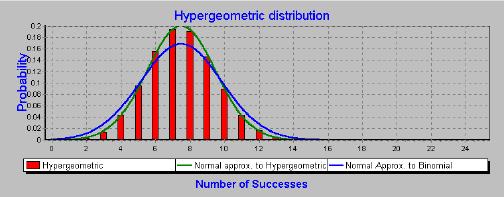
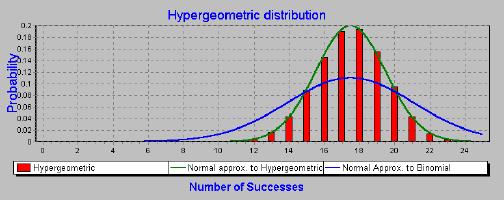
    Confidence intervals for proportions are based on the shape of the standard error of the proportion. Most analyses of survey data calculate confidence intervals based on the standard error of the proportion following the normal approximation to the binomial. For small populations this confidence interval will be inaccurate - it will be too wide. A more accurate procedure is to calculate the confidence intervals based on the normal approximation to the hypergeometric. The following two charts demonstrate the superior accuracy of this method when calculating confidence intervals using the normal curve.

    The following chart the population size is 100, and the sample size is 30. We can see that the normal approximation to the hypergeometric gives a slightly better fit than the normal approximation to the binomial. The normal approximation to the binomial is too wide.

    In the next chart, the population size is 100, and the sample size is 70. Again we see that the normal approximation to the binomial is too wide. As the sample fraction (sample size divided by population size) becomes larger, the confidence intervals decrease.

    Calculating the confidence interval

    Confidence intervals for proportions for small populations are calculated using the normal curve. In this case we use the normal approximation to the hypergeometric. The mean and variance of the normal approximations are given below:

  • The mean for both normal approximations is the same.
  • The second formula is the variance for the normal approximation to the binomial.
  • The third formula is the variance for the normal approximation to the hypergeometric.

    As the sample size approaches the population size, the variance decreases. When the sample size is equal to the population size, the variance is equal to zero. In this case there is no uncertainty about the population proportion.