
Fall 1998
Thank you for participating in the Survey of Student Attitudes and Experiences. In November, 1998, students in Social Studies 306 surveyed 712 undergraduate students in 25 classes. The information you gave us about yourself is part of this sample of University of Regina undergraduate students. This Report highlights some of the Survey findings.

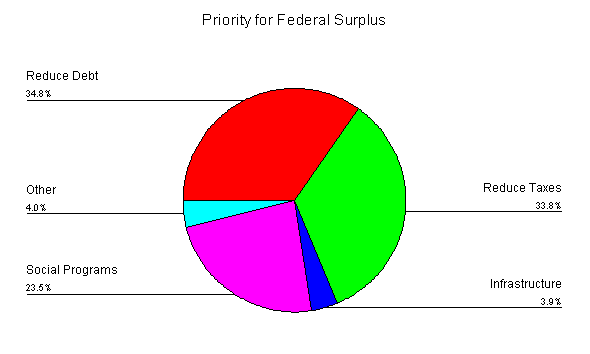
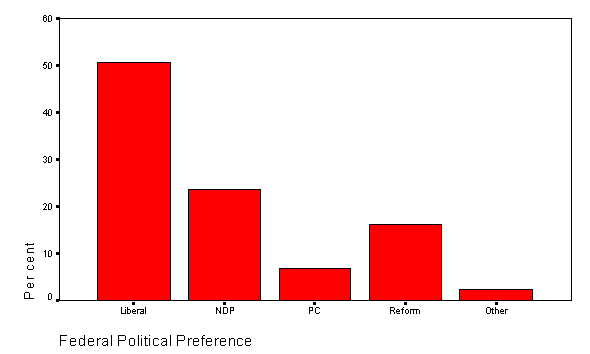
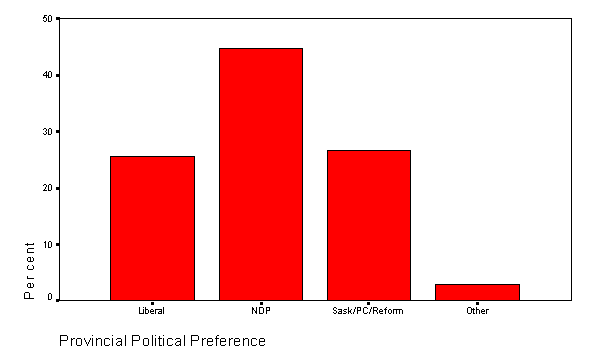
Left or Right? Progressive or Reactionary? Of the students surveyed, approximately 30 per cent feel that none of the political parties best reflects their political views. Of those supporting a party, 45% support the NDP at the provincial level and 50% support the Liberals at the federal level. Almost 70% of students think that a federal surplus should be used to reduce either taxes or government debt. Only 23% say that the federal surplus should be used to expand social programs. Students are strongly opposed to user fees for health care and think that the provincial government should devote more tax dollars to health care. While few students say that welfare should be ended, two-thirds say that welfare recipients should have payments cut if they do not look for work. Opinion concerning recognition of gay and lesbian couples as married is split – with forty per cent favouring such recognition, one-third opposing it, and only one-quarter in the middle. Students generally respect governments but show less respect for politicians, with 50 per cent of students saying that they lack respect for politicians.
|
Opinion |
% Disagreeing |
% In the Middle |
% Agreeing |
|
Free trade is positive for Canadians |
20% |
44% |
36% |
|
Stronger affirmative action |
26% |
39% |
35% |
|
Recognize gay couples as married |
34% |
26% |
40% |
|
Increase taxes on big corporations |
11% |
27% |
62% |
|
Establish user fees for health care |
72% |
14% |
14% |
|
More tax dollars for health care |
15% |
34% |
51% |
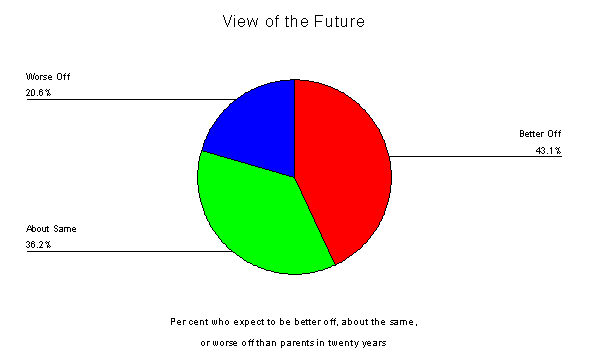
Optimistic About the Future. In contrast to media reports of doom and gloom about the future, students are generally optimistic that twenty years from now, they will be better off economically than their parents are at the present time.
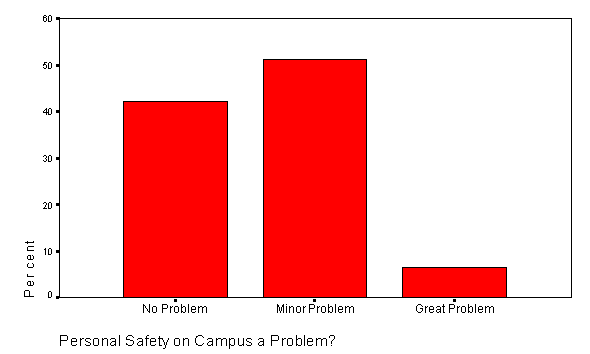
Concerns About Campus Safety. While campus safety is not viewed as a major problem, those students surveyed have many suggestions concerning how to improve campus safety. Approximately 20% of students suggest increasing or improving personnel in security operations and another 20% suggest that more or better lighting could help improve safety on campus. Among other suggestions are more telephones and security cameras.
Is the University Preparing Students for a Technological World? Of the students surveyed, 70% say they are somewhat knowledgeable about computing. Lack of access to computing facilities is a problem for just over one-quarter of students surveyed. While about the same percentage consider the University to be doing a poor job of preparing students technologically for employment, almost one-third consider the University to be doing a good job in this area.
Stress. Academic matters and balancing school, work, and life appear to cause more stress among students than do relationships with parents, peers, or friends. In order to help relieve stress, students report involvement in a fairly conventional range of activities.
|
Activity |
Per Cent High Stress |
Activities to Relieve Stress |
Per Cent Reporting |
|
Academic performance |
47% |
Go out with friends |
80% |
|
Balancing work, school, life |
46% |
Exercise or sports |
70% |
|
Finances |
39% |
Watch TV |
65% |
|
Class workload |
36% |
Consume alcoholic beverages |
40% |
|
Boy/Girl friend relations |
12% |
Smoke |
20% |
|
Relations with parents |
7% |
Use recreational drugs |
8% |
Professors can be a problem for students. The chart shows that professors do reasonably well in respecting students and challenging them to think. But professors might do more to get students involved in classes, make classes more dynamic and interesting, and ensure fair grading.
|
Situation Experienced |
Rarely |
Sometimes |
Always |
|
Professors challenge student to think |
7% |
67% |
26% |
|
Professors respect students |
10% |
65% |
25% |
|
Grading systems are fair |
11% |
77% |
12% |
|
University classes are dynamic and interesting |
10% |
83% |
7% |
|
English proficiency of some professors is a problem |
32% |
55% |
13% |
Multiculturalism. There are many aspects to multiculturalism in Canada. The table below shows general support for a wide range of multicultural activities, but limited support for government funding of festivals and special events.
|
Aspect of Multiculturalism |
Per Cent Agreeing |
|
Institutions should provide equal access to jobs |
91% |
|
Canadian society is enriched by diverse cultures |
84% |
|
Institutions should eliminate barriers to participation |
76% |
|
Cultural and racial diversity is a fundamental part of Canada |
75% |
|
Ethnic groups should preserve cultural heritage |
72% |
|
Government should fund festivals and special events |
43% |
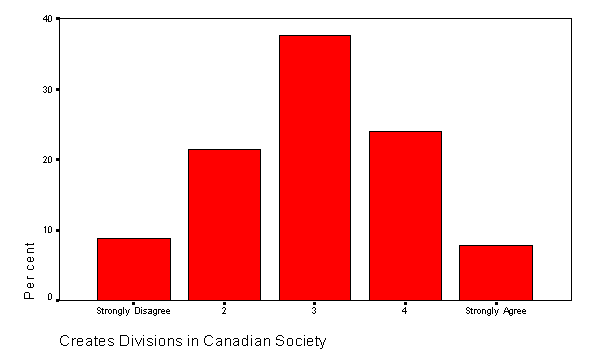
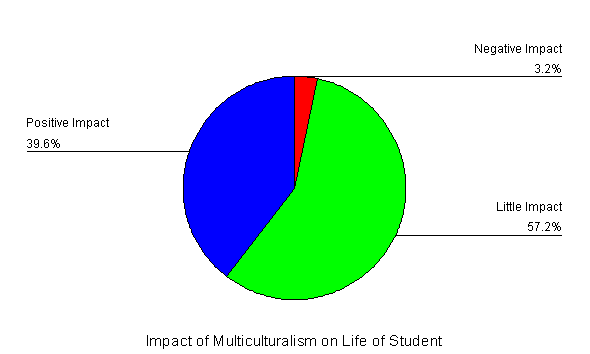
Effect of Multiculturalism. In recent years, multicultural policy has often been criticized for being divisive and ineffective. The bar chart below shows that among students there is neither strong support for nor strong disagreement with this. About 30% of students report that multicultural policy addresses problems of racism, but 20% say that it does not. The pie chart below provides little evidence that the impact of multiculturalism has been negative. Overall, students consider multicultural policy as positive, but perhaps not as effective as it might be.
Immigration. Most students have a view on immigration, with 17% saying that immigration to Canada should be reduced, 72% saying it should remain the same, and 11% expressing the view that Canada should expand immigration. Only 12% of students view the change in immigration from European to Asian, Caribbean and other non-European places as negative. At the same time, just under 40% of students are concerned that more immigration means fewer jobs for Canadians.
Identity. Three-quarters of students identified themselves as Canadian, another 10% as ethnic-Canadian, e.g. Chinese-Canadian or Greek-Canadian, and 9% identified themselves as simply of their own ethnic origin. 6% of students said they had full or partial First Nations, aboriginal, or native ancestry. Among the aboriginal groups represented in the Survey are Cree, Métis, Ojibway, Assiniboian, and Dakota. Students in the sample are multiethnic, with just under two-thirds reporting more than a single ancestry, and 24% reporting three or more ancestries. The most common ethnic or cultural ancestries reported are German (35%), English (23%), Scottish (23%), Irish (16%), Ukrainian (14%), French (10%), and Polish (7%).
Spiritual values. Students surveyed generally report that religious or spiritual values are important to them. Thirty per cent say that these values are very important and another forty per cent say these are somewhat. The most common religious groups are Roman Catholic, United Church, Lutheran, and Anglican.
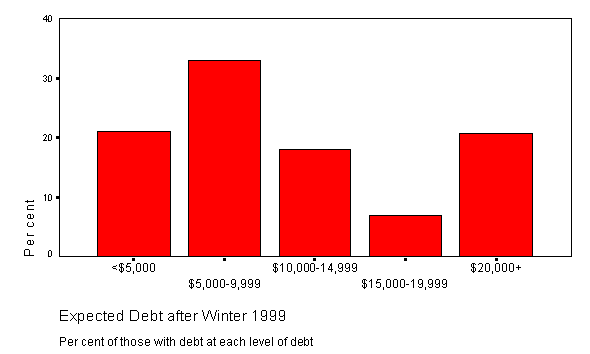
Finances. Students finance their studies in a variety of ways, with the most common sources of finance being family support, summer employment, employment during the semester, and student loans. At the start of this semester, 30% of students reported having no student debt, but for those with such debt, the mean debt was $9,600 and the median $7,000. By the end of the Winter, 1999 semester, 39% of students expect to have debt, with a mean expected level of $11,339 and a median of $8,000.
|
Source of Finance for Attending University |
Major Source |
Minor Source |
|
Employment in semester |
27% |
33% |
|
Summer employment |
38% |
26% |
|
Savings |
22% |
24% |
|
Student loans |
25% |
15% |
|
Personal loans |
10% |
145 |
|
Scholarships |
14% |
20% |
|
Family |
39% |
22% |
|
Indian Affairs |
5% |
9% |
Ninety per cent of students disagree with the view that governments should stop financing university and 75% say that university should become more accessible by lowering tuition. Many students seem very judgmental of their peers, with 53% of those surveyed saying that some university students would be better off attending technical school or working.
Student Employment Patterns. In the Survey, 60% of students have jobs and those with jobs average 20 hours of work per week. One-fifth of these work at jobs 10 hours or less a week and one-half average 20 or more hours a week at jobs. Average hourly pay is $9.80 an hour, with 10% reporting pay of $5.60 or less an hour and 15% reporting pay of $15.00 or more an hour.
Who You Are. Females are 63.0% of the sample and males 37.0%. This means that we sampled classes with a disproportionate number of females. To be representative of the student body we should have had 60.6% female and 39.4% male in the sample. Just under one-half live with parents or other relatives, 15% with a spouse or partner, 20% with friends, 14% live on campus or alone, and 3% are single parents. Among all respondents, 11% have children and those with children average 1.9 children. One-fifth of students surveyed were age 25 or over and the rest were between ages 17 and 24. In the Survey, 30% of respondents are first year students, 20% are second year, and one-quarter are in each of third year and fourth year or higher.
Social Studies 306 Students and Instructor Thank
:http://uregina.ca/~gingrich
Note on this Report. This Report was prepared on November 29 and 30, 1998 for distribution to the classes in which the Survey was conducted. The content of this web page is the same as the printed copy of the Report. The format differs slightly because it is difficult to adapt all parts of the printed version to the web version.
The Report provides a general overview of the results of the Survey. Since the Report was produced very quickly, it does not provide a detailed examination of the issues examined in the Survey or the connections among variables. The frequency distributions for all the Survey variables can be obtained by following the links in the Survey Questionnaire and Results. If you wish to obtain cross-classifications of the relationships among variables or conduct a more detailed analysis of the data set, contact: Paul Gingrich.
Return to the Survey introductory page.
This page was last edited on December 31, 1998