Social Studies 201
Fall 2003
Final Examination
9:00 a.m. – 12:00 noon, Wednesday, December 10
Answer any three questions – each question has equal
value
Note. For each answer, state any assumptions adopted and any confidence or significance levels adopted. When appropriate, state possible errors involved in your conclusions.
Grades. If you would like the grades for all the problem sets and exams you have completed, send me an email at paul.gingrich@uregina.ca and, once I have calculated final grades, I will send your grade.
1. Attitudes toward police. Professor Henry Chow, of the Department of Sociology and Social Studies, authored the article “Police-Community Relations: Chinese Attitudes toward the Police in Toronto,” in Canadian Ethnic Studies, XXIV, No. 2, 2002, pp. 90-101. The data in attached Table 1 come from this article. Each of the fourteen items in the table was measured on a five-point scale, from 1 meaning strongly disagree to 5 meaning strongly agree. A mean of 3 implies a neutral response, above 3 a positive response, and below 3 a negative response. The sample size was 402 respondents. For Chinese in Toronto:
- Test whether the mean for item 6 (tighter control of use of firearms) is less than 3. Test whether the mean for item 11 (prompt response) exceeds 3.
- Obtain interval estimates for items 10 (treatment not unfair) and 13 (police maintain close contact with Chinese community).
- In the article, Chow states that “respondents were only marginally positive in their perceptions of the police as indicated by the relatively low mean values for the 14 items (i.e., between 2.42 and 3.64).” From the results in a. and b., and the means for the other items, comment on Chow’s claim that responses were positive, but not strongly so.
2. Television and internet use. The data in Table 2 come from Saskatchewan respondents aged 15-24 surveyed in Statistics Canada, 2000 General Social Survey, Cycle 14: Access to and Use of Information Communication Technology. Use these data to answer the following for Saskatchewan residents aged 15-24:
- Test whether the mean hours of (i) television use and (ii) internet use at work differ from 11 hours per week (0.01 significance level).
- Obtain a 95% confidence interval for mean hours of internet use at home.
- How large a sample size would be required to obtain the true mean hours of internet use correct to within one hour, with 98% confidence?
- A researcher claims the mean hours of television use and of internet use at work and at home are each 11 hours per week. From the results of a. and b., what do you conclude about this claim?
Table 2.
Statistics of weekly hours of television and internet use, Saskatchewan
respondents aged 15-24 who used each service, General Social Survey, Cycle 14, 2000
|
Variable |
Mean hours per week |
Standard deviation of hours per week |
Sample size |
|
Watch television |
13.46 |
10.18 |
180 |
|
Use internet at home |
9.03 |
9.61 |
63 |
|
Use internet at work |
7.60 |
10.80 |
15 |
|
Use internet at school |
3.98 |
3.89 |
45 |
3. Shift work and health. The data in Table 3 come from a survey of Canadian workers who work evening and regular shifts. The percentages in the table refer to the percentage of workers, of each characteristic, who report psycho-social difficulties.
- For each of married men and women working evening shift, obtain an interval estimate for the proportion who report problems with their partner.
- Test whether (i) the proportion of males working evening shift reporting high stress exceeds the proportion of males working regular shift that report high stress, and (ii) the proportion of females reporting high stress differs for those working evening and regular shift.
- Using these results, comment on the following statement. “For men, the evening shift was particularly associated with psychosocial difficulties. Married men working an evening shift were more likely than those working regular daytime hours to report relationship problems. … On the other hand, women working the evening shift did not report similar psychosocial problems.” (from Margot Shields, “The health of Canada’s shift workers,” Canadian Social Trends, Summer 2003, No. 69, p. 23).
Table 3. Psycho-social difficulties of men and women workers with different types of work schedules. Per cent of each group reporting difficulty
|
Characteristic of worker and psycho-social problem |
Evening shift |
Regular shift – per cent |
|
|
Per cent |
Sample size |
||
|
Men – high stress |
44% |
137 |
33% |
|
Married men – problems with partner |
36% |
93 |
16% |
|
Women – high stress |
41% |
149 |
43% |
|
Married women – problems with partner |
29% |
99 |
21% |
Source: Margot Shields,
“Shift work and health,” Statistics Canada, Health
Reports, Volume 13, Number 4, (catalogue number 82-003-XPE), Tables 1 and
2.
4. Sample size for surveys. The data In Table 4 come from Decima Research Inc., one of the major Canadian public opinion and marketing research companies. Decima reports using these sample sizes in a survey of Canadians regarding use of telecommunications such as cell phones.
- Verify the margin of error in the last row of Table 4. Show your work.
- What is the width of an interval estimate for the proportion of cell phone users in (i) Quebec, and (ii) Manitoba/Saskatchewan?
- How large a sample size would be required in order to obtain an interval estimate of the proportion of cell phone users in the Territories, correct to within 4 percentage points, 17 in 20 times?
- For an opinion question asked on a five-point scale from 1 to 5, how large a sample size would be required to obtain a 95% interval estimate of a population mean correct to with 0.1 points on the scale? (Table 1 or Table 5 may be helpful in answering this question).
Table 4.
Sample sizes used by Decima Research Inc. in a survey of Canadians
regarding use of telecommunications
|
Region |
Number of interviews |
Percentage of population |
|
Atlantic |
305 |
8% |
|
Quebec |
205 |
24% |
|
Ontario |
200 |
38% |
|
Manitoba/Saskatchewan |
101 |
7% |
|
Alberta |
90 |
9% |
|
British Columbia |
90 |
13% |
|
Territories |
21 |
0.3% |
|
Total |
1,012 |
|
|
Margin of error on the total (95% confidence) |
|
|
Source: Decima Research Inc./Bell Canada, Canadians’ Usage and Views Regarding Telecommunications, Table B. p. 9. From web site http://www.bce.ca/en/study/decima-en.pdf, 2003. Obtained on December 7, 2003.
5. Mean support for corporate taxes and political preference. In the Fall 1998 Survey of Student Attitudes and Experiences, students were asked to state their view on the statement “Taxes on big corporations should be increased.” This variable was labeled V5, and responses to V5 were provided on a five-point scale from 1 meaning strongly disagree to 5 meaning strongly agree.
a. A small random subsample of seven NDP and seven Liberal supporters was taken from the whole data set. For NDP supporters responses were 3, 4, 3, 5, 5, 3, 5; for Liberal supporters responses were 3, 4, 4, 2, 5, 4, 4. Compute the mean and standard deviation for each of these two samples and, using these, obtain the 90% confidence intervals for mean opinion of (i) all NDP supporters and (ii) all Liberal supporters.
b. Table 5 contains means and standard deviations for the whole sample. Test whether mean support for V5 exceeds 3 for Saskatchewan Party supporters.
c. A confidence interval for the mean of all Liberal supporters is from 3.48 to 3.90. From this, an analyst argues that Liberal support for increasing corporation taxes is less than for NDP supporters. Comment on the analyst’s statement.
Table 5. Means
and standard deviations of V5, classified by provincial political party
supported
|
Provincial political party supported |
Mean |
Standard deviation |
Sample size |
|
Liberal |
3.69 |
1.04 |
97 |
|
NDP |
3.94 |
1.01 |
174 |
|
Saskatchewan |
3.55 |
1.08 |
99 |
|
Total |
3.77 |
1.05 |
370 |
6. Relation between corporate taxes and political preference. Table 6 contains a cross-classification of responses to V5, classified by provincial political preference. These date come from the same survey as in question 5.
- Calculate the point estimates for the proportion of supporters of each of the three parties who agree with V5 (i.e. response 4 or 5). Select one of the political parties and obtain an interval estimate for the proportion of all supporters of that party who agree with increasing corporate taxes.
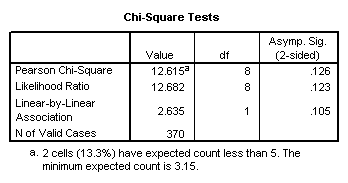
- Using Tables 6 and 7, comment on the relationship between V5 and provincial political preference using the chi-square test.
- From a. and b., and Table 6, write a short note about levels of support for increasing corporate taxes among supporters of the three parties.
Table 6. Cross-classification of responses to V5 by provincial political preference. Counts and expected counts.
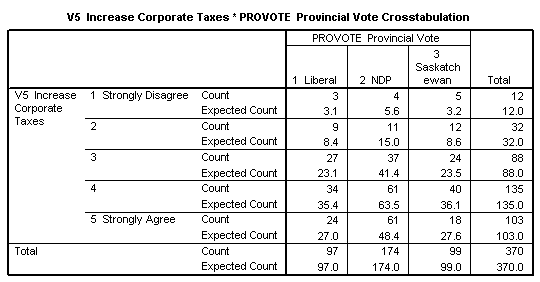
Table 7. Chi-square
statistics for data in Table 6.